
Identify Your Best Customers And Acquire More Just Like Them
Everyone who plays in the sandbox of Managed Services knows that not every customer is created equal. Even though customer retention is high, relationships are not without their ups and downs. The one thing that I have learned is that the famous “80/20 rule” applies not only to good IT customers, but to bad IT customers as well. It often seems as though 80% of your headaches and aggravation come from 20% of your customer base. So how can you remove this stress? The obvious answer is to find better customers.
Finding good customers is easier said than done, mostly because it is difficult to really quantify what a good and bad customer is. If you ask around your office, you are likely to get feedback skewed toward your employee’s sole interaction, especially if your company has specialized roles. For example, if you ask your Help Desk who the best customers are, they are likely to name customers who open the least amount of tickets. If you ask the Sales department, they are going to prefer customers that approve projects and pay a high rate. If you ask your Bookkeeping department, they will likely tell you the ones who pay on time. After constantly getting mixed signals from our team, we eventually developed a customer analysis system that we call the 5 R’s.
What Are The 5 R’s Of A Good IT Customer?
The 5 R’s is a way to quantify the overall value of a customer using five different, equally weighted “scores” that get averaged out to produce a customer ranking system. These five things consist of the most important factors in building a long term win/win partnership with your customer. Here is a brief summary of each of the 5 R’s and why it is an important factor in building a healthy customer accord.
R #1: Rates
The first ‘R’ is the rate in which you bill the customer. Some customers are willing to pay you more for your services than others. This could be budgetary, because they value your service more, or even because they are located in a different market. Either way, some customers pay higher rates and generate more profit for your bottom line, which is a major trait in the DNA of a quality customer.
R #2: Requirements
The second ‘R’ is requirements. Not every customer adheres to your technology standards or actively looks to put in the resources required to improve their network infrastructure and workflows. The customers that do constantly seek improvement are often the easiest to support and can generate significantly more revenue from project sales. When customers don’t adhere to technical requirements, they can over-utilize your time on issues that are completely avoidable.
R #3: Relationships
The third ‘R’ is relationships. Regardless of the technical or financial aspects, some customers are better to work with on a personal level. They treat you and your team with respect and your relationship with them extends beyond a Business to Business vendor agreement. These type of relationships are not easy to come by and should be valued for how significant they are. When customers are difficult to work with and even become verbally abusive, it can have a significant negative impact on morale.
R #4: Referrals
The fourth ‘R’ is referrals. There is a compounding benefit to having customers that network often and refer business. It is so valuable that some MSPs rely on this exclusively to grow their business. The truth is though, you are more likely to cater to a bad customer that refers you business far longer than you should, which can sometimes lead to toxic relationships.
R #5: Receivables
The fifth ‘R’ is receivables. Customers that pay on-time are an incredible asset to your business. When cash flows in consistently and you do not have to waste resources on collection efforts, or leveraging credit to make payroll, it makes operating your business a whole lot easier. Even though you may have a great relationship with a customer, that doesn’t guarantee their check will arrive on time, sometimes complicating an otherwise fruitful relationship.
The Ultimate Guide To Cash Flow For Managed Services
Sponsored by Alternative Payments & Zest
Grading Your Customers Using the 5 R’s System
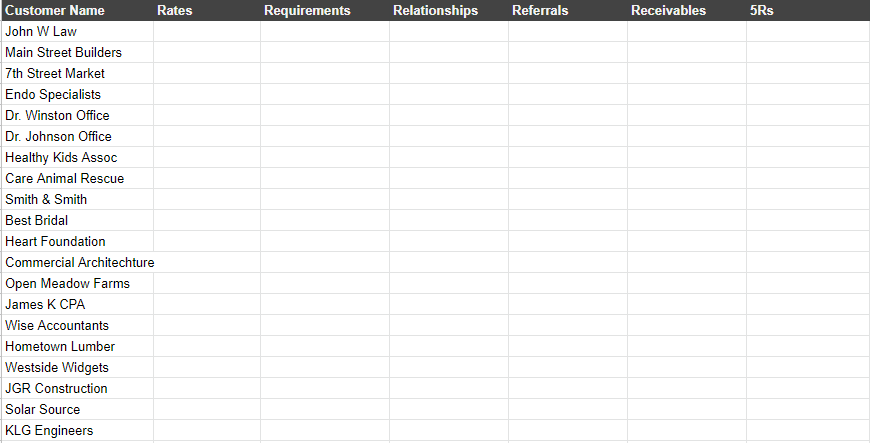
Now that you know what the 5 R’s are, it is time to put them to use. The best way to grade your customers using this system is through a simple spreadsheet.
List your customers along the left column and then create an additional column for each of the 5 R’s thereafter. You will also want to create a final column to calculate the average score for each customer. Here is an example of how this spreadsheet would look.
To begin filling in your data, simply grade your customer on each column using a 1-10 scale; 1 being bad and 10 being good. It is best to have someone complete this that has intimate knowledge in every aspect of the business and your customer base. This is difficult for larger MSPs, so in this case, it may make sense to create a web based survey to pass around to whichever teams would yield the best data for each customer and then collect and compile it accordingly.
Here is an example of a completed 5 R’s table ranking 20 faux Managed Services customers. This data was randomly generated and is only to serve as a demonstration.
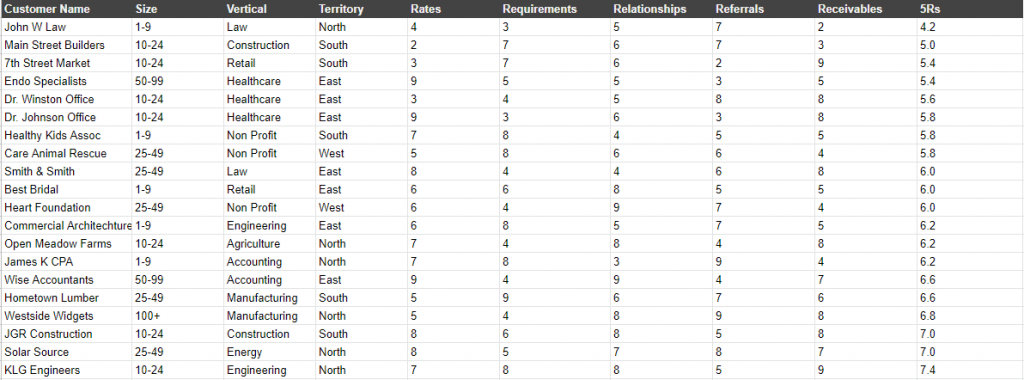
As you can see, we also added additional columns so that we could segment our customer data in different ways. This aggregation is important in the actionable part of our overall strategy, which is finding more good customers.
The Ultimate Guide To Cash Flow For Managed Services
Sponsored by Alternative Payments & Zest
Aggregating Customer Data To Identify Trends
When your data sample is complete, it is fairly simple to generate a chart to see who your best and worst customers are, according to this system. You will likely find that this is a pretty accurate reflection of the general feeling you and your team have toward your customer relationships, although some may surprise you.
Here is a ranking chart that was created from our data sample shown previously to give you a visualization of what your ratings look like.
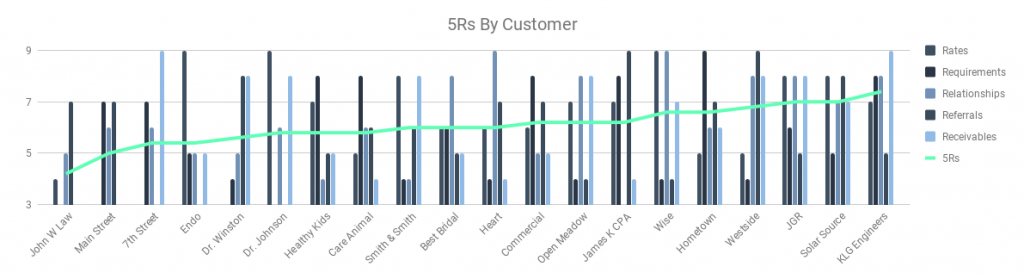
The next part of this process is the most important, because we ultimately want to find what our best customers have in common. By changing the X-axis of our chart to aggregate additional fields of data, we can now see rankings in factors such as vertical, company size, territory, or any other data you want to include.
Here are a few examples of charts from our sample data that demonstrate this type of segmentation.
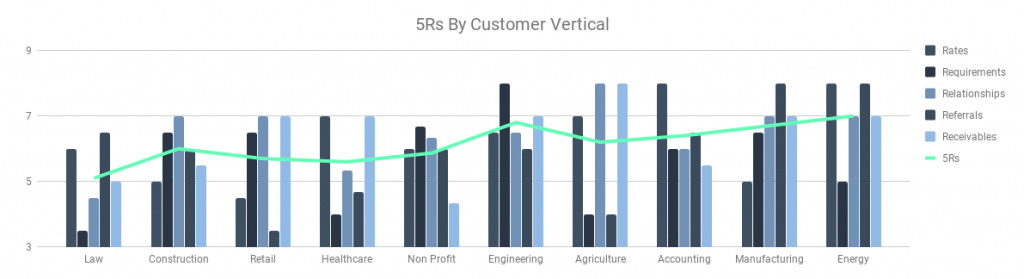
As you can see, it becomes fairly obvious that our best verticals are Energy, Engineering, and Manufacturing.
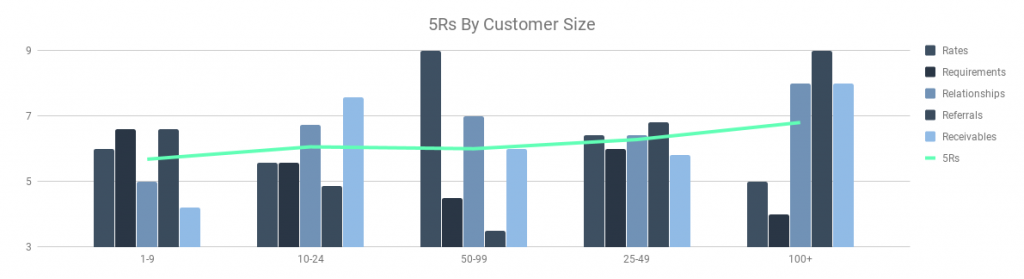
We can also make the assumption that smaller customers are slightly more difficult to work with than larger customers.
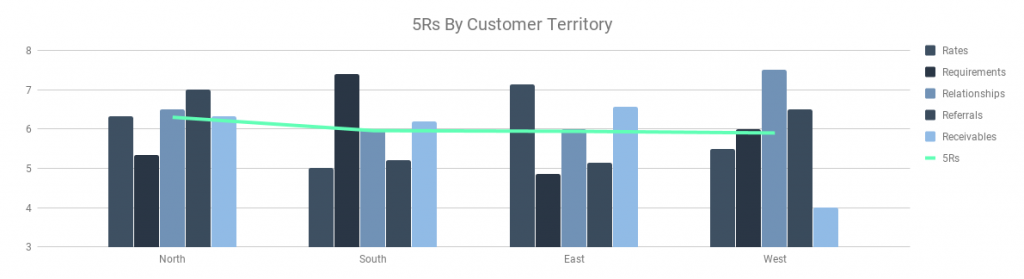
According to our data it appears that customer territory has little impact on the value of our customer although North is preferred.
Targeting Prospects That Make The Best Customers
The objective in doing this analysis is to always be adding new customers to the top of the list, not the bottom. This means, as it relates to our sample, that if I received a lead for a large Engineering Firm in our northern territory, then I should work extremely hard to close them. Statistically, this lead should generate a great customer for our business.
At the same token, I may want to stop generating leads for verticals that typically produce poor customers. In the case of our sample data, we would look to avoid targeting Law Firms and Healthcare Providers with fewer than 10 employees. This will ensure that we are not adding new customers to the bottom of the list that will be more trouble than they are worth.
While this system is not an exact science, the process of evaluating customers and being intentional in your acquisition is invaluable. I encourage you to use this system, or your own, to constantly track, analyze, and optimize the value of your customer relationships. As I have said before, not every opportunity is a good opportunity in Managed IT. The better you are at recognizing bad deals, the easier it is to operate and grow your business.

SPONSORED BY ZEST


